White Paper
Wide Bandwidth Accelerometers for Condition Monitoring
INTRODUCTION
Machine condition monitoring and predictive maintenance relies upon early detection of changes in the vibration spectrum that are indicative of defects or wear. As market trends lead toward the monitoring of higher-volume and smaller systems, the signal bandwidth of interest also increases. It is now also possible to embed accelerometers directly into equipment for condition monitoring. This white paper will illustrate the requirement of wide bandwidth monitoring with a discussion of possible sources along with both simulation and experimental results of defect conditions.

Most machinery that is driven by large electric motors will have an input drive running at a speed of between 900 and 3600 rpm (15 to 60 Hz). This fundamental frequency can easily be monitored using accelerometers with relatively low bandwidth, but the information that this signal yields may be limited to imbalance condition only.
Rolling-element bearings are a common cause of machine failure. As bearing defects begin to occur, the vibration level produced in the early stages of failure may be very low and could be masked by vibration from other sources. Frequency-domain analysis is very useful for revealing small signals that may be hidden in the time-domain. Bearing characteristic frequencies are generally many times higher than the running speed (around 50% of the number of balls times the running speed) and may be present even when equipment is in good condition. Bearing defects tend to be impulsive, which produces a series of harmonics spaced at the characteristic frequency, extending to very high frequencies.
Gears represent another case where high multiples of running speed/frequency will be generated, although gearboxes can be significantly more complex to analyze. The basic gear-mesh frequency is given by the product of the number of teeth and the running speed in Hz. The magnitude of sidebands or harmonics of this frequency can indicate the onset or severity of various defects. Gears will also possess their own natural frequencies, which may be excited by impulsive defects or by strong vibration at higher frequencies.
Blades and vanes again generate vibration at a multiple of running speed, even when in good condition. The blade passing frequency is given by number of blades times the running speed. A missing blade will generate a large number of harmonics of the blade-pass frequency (as well as increasing imbalance at 1 x running frequency).
Mechanical looseness is also very likely to cause many harmonics of running speed to appear in the spectrum. In general terms, looseness can cause discontinuities in motion, and sudden changes in position or displacement can produce very high levels of acceleration.
WIDE BANDWIDTH SIMULATIONS
To illustrate the general nature of mechanical discontinuities, a numerical simulation is presented below. Part of a mechanism is assumed to displace nominally ±5 mm at a frequency of 50 Hz. To create a simulated discontinuity, we clip the displacement, on positive excursions only, at 4.98 mm, as highlighted in the zoomed trace at right:
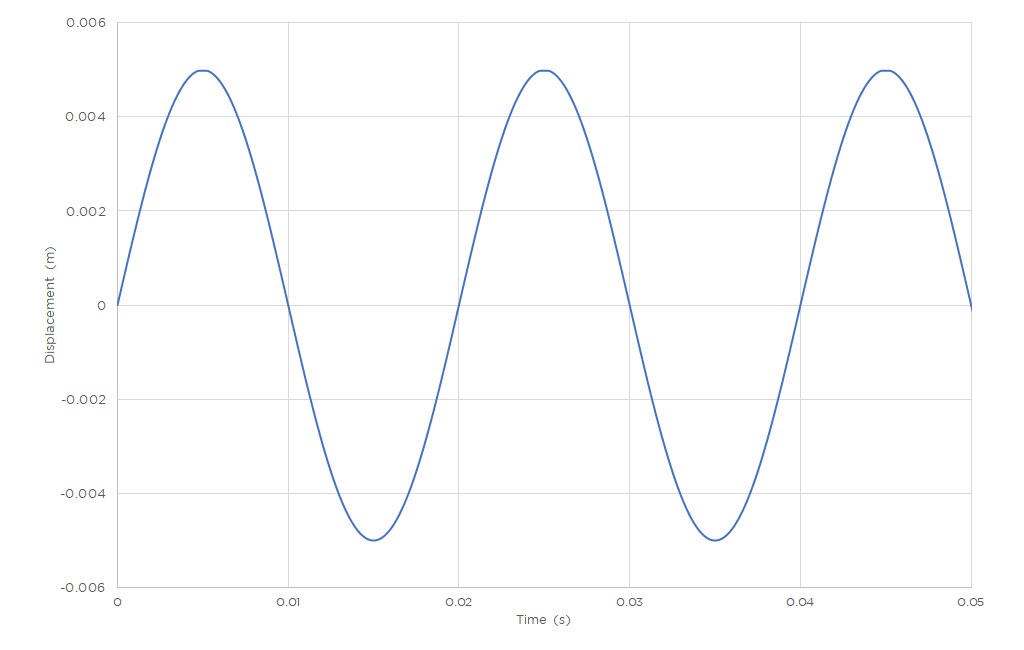
FIGURE 1. DISPLACEMENT CURVE WITH CLIPPING

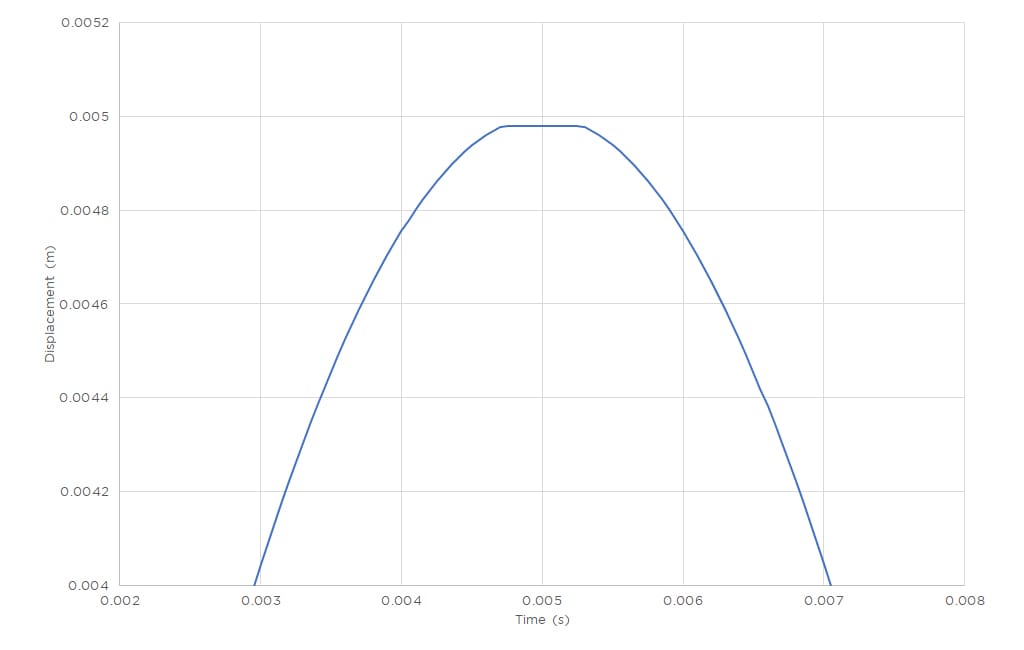
FIGURE 2. ZOOMED REGION OF DISPLACEMENT CURVE WITH CLIPPING
The corresponding acceleration plot shows the underlying sinusoidal acceleration component at ±50.3 g but with impulses generated by the start and end of mechanical clipping (with -237 g peaks):
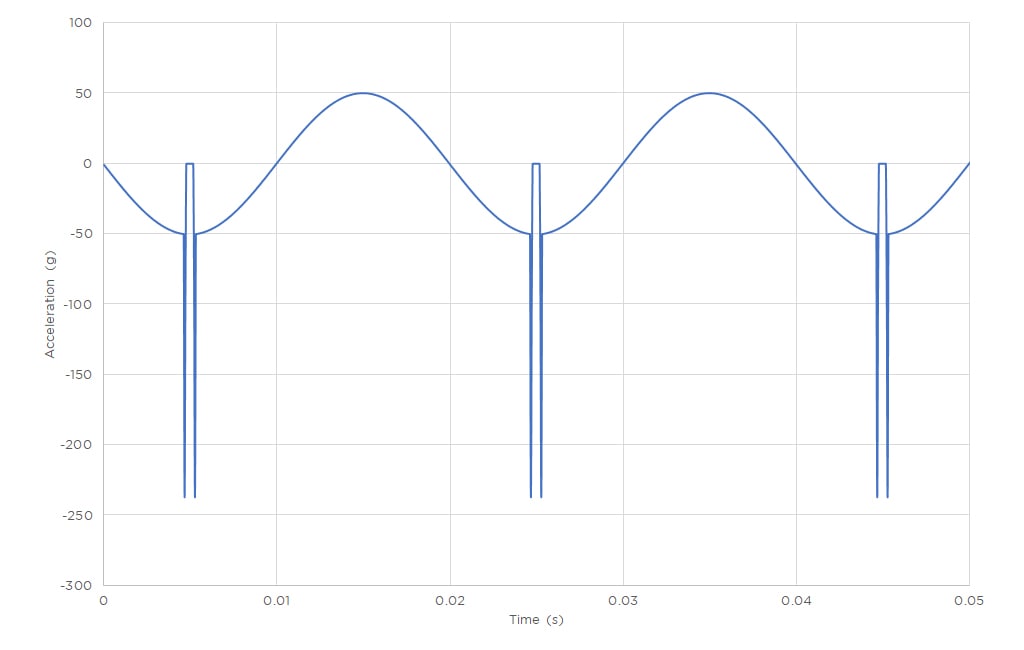
FIGURE 3. ACCELERATION CURVE CORRESPONDING TO CLIPPED DISPLACEMENT CURVE
Now, the corresponding FFT result, first with full bandwidth, then a zoom of first 2 kHz:
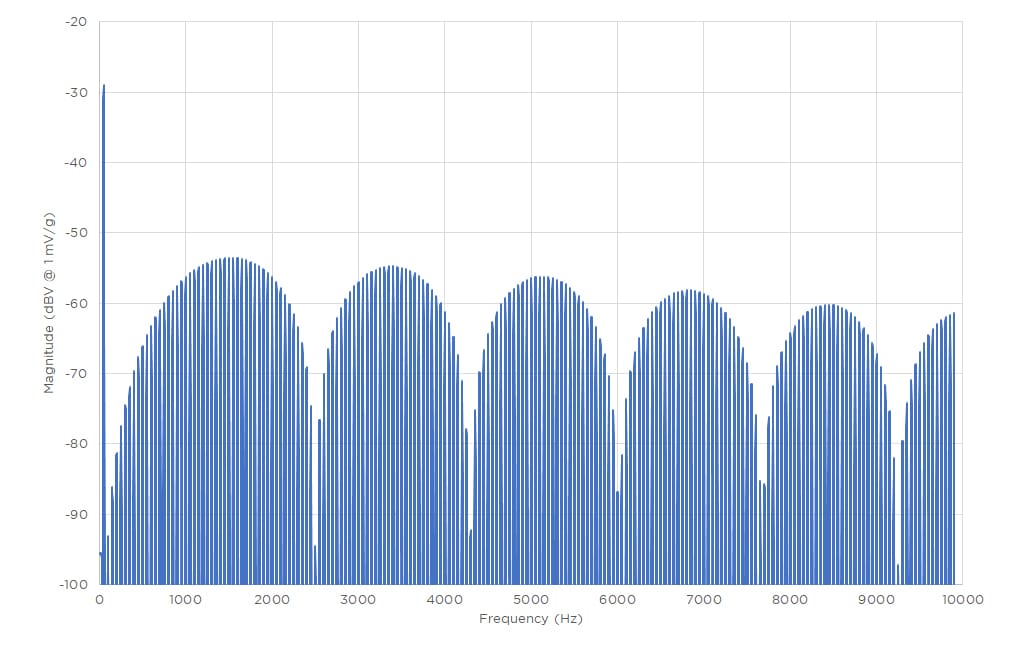
FIGURE 4. FFT RESULT AT FULL BANDWIDTH
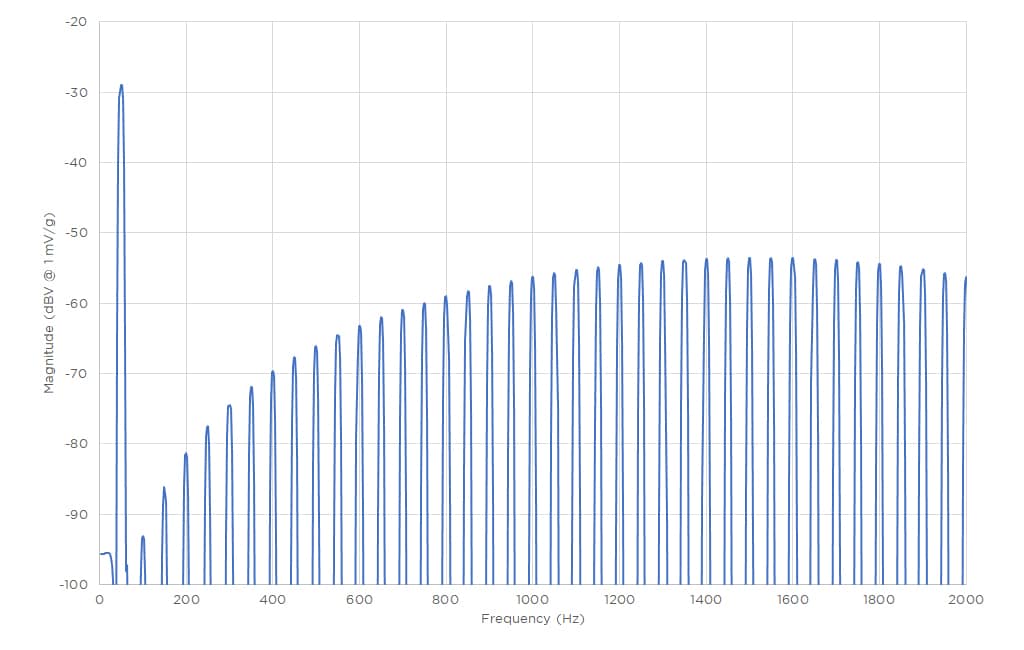
FIGURE 5. ZOOMED FFT SHOWING HARMONIC STRUCTURE
The 0.020 mm “defect” has introduced significant signal energy over a very wide bandwidth, as a series of closely-spaced harmonics of the running speed. In this simulation, the magnitude at 10 kHz is only a few dB below the level around 1500 Hz, and signal energy would continue out well beyond 10 kHz.
Now, what happens if we limit the bandwidth of the sensing device (accelerometer)? In the simulation below, a digital low-pass filter at 5 kHz was applied to the same data:
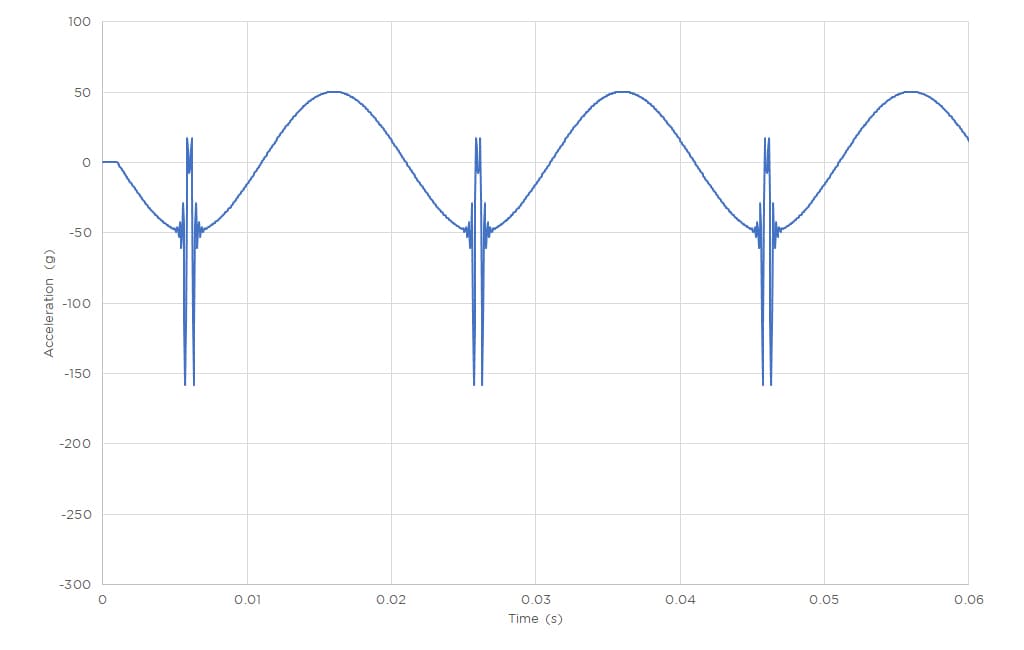
FIGURE 6. ACCELERATION RESULT WITH LIMITED BANDWIDTH
In this case, instead of the negative-going peaks reaching -237 g, the bandwidth restriction has reduced these to -158 g (a drop of one-third).
Although this numerical simulation is not intended to represent any specific real-world case, the general principles are valid: abrupt mechanical discontinuities in motion cause short acceleration impulses. The impulses produce broad-bandwidth energy in the spectrum, and a sensor which is limited in bandwidth will not capture the full extent of the transient events.
Even very large, slowly-rotating structures (such as wind turbines) may be coupled to gear sets with multiple stages and very high tooth count. Signal energy above 10 kHz is considered useful for early detection of defects, as it can be well clear of lower-order vibration at higher amplitude levels which may be present in normal running conditions.
Individual events which create fracture or spalling can release energy over a very wide bandwidth (dynamic strain measurements have shown ultrasonic energy out to 1 MHz). Although conventional accelerometers cannot be expected to capture such a wide bandwidth, audio-band signals may indicate some likelihood of damage.
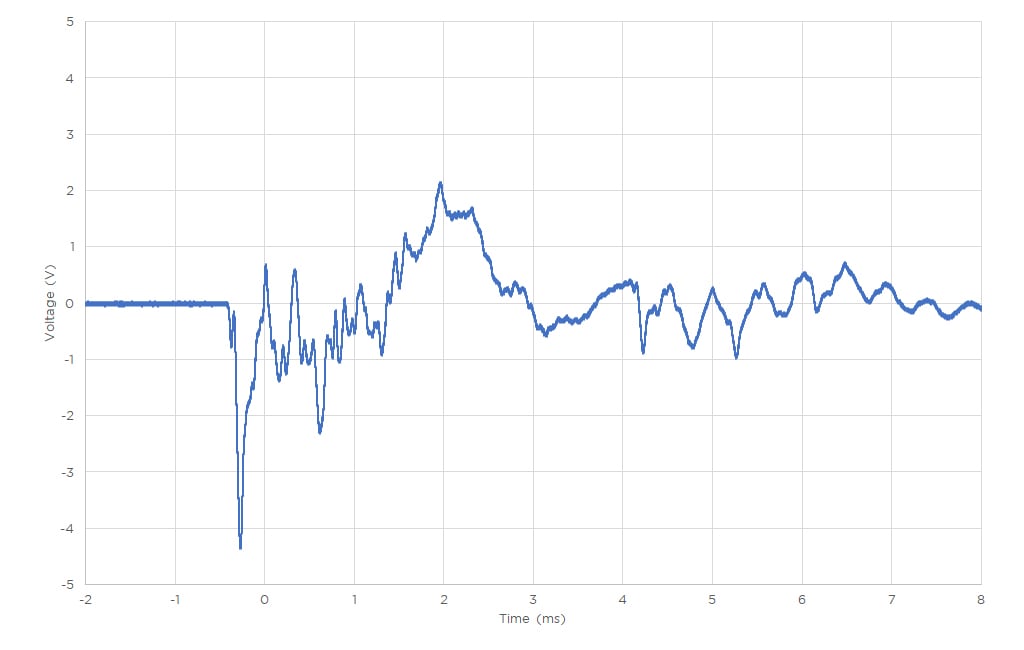
FIGURE 7. TIME TRACE METAL TO GLASS IMPACT WITHOUT FRACTURE
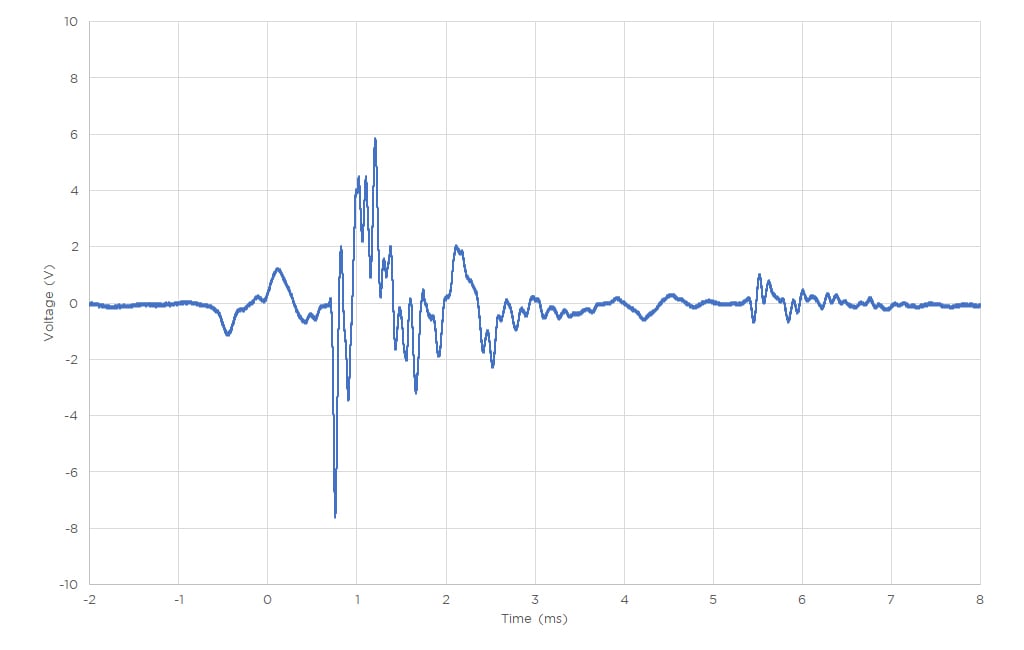
FIGURE 8. TIME TRACE METAL TO GLASS IMPACT WITH FRACTURE
Two time traces are shown above, on the left is a hard metal-to-glass impact which caused no visible damage; on the right, a metal-to-glass impact which caused limited local spalling of the glass (in an area less than 1 mm diameter). Their spectra are overlaid below.
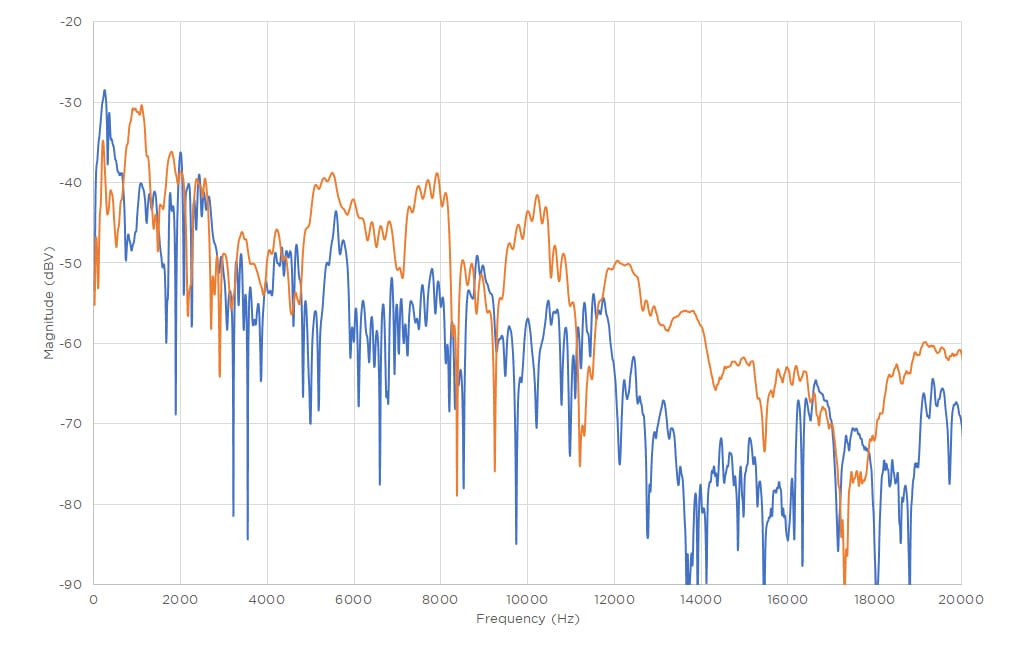
FIGURE 9. FFT COMPARISON WITH AND WITHOUT FRACTURE
The blue curve is impact with no spalling, orange is with spalling. There is good separation generally in the range 5 kHz to 15 kHz, and particularly from 12 – 15 kHz.
While these are transient (time-limited) events with relatively high energies, we may consider some forms of machine wear to be a continuous series of microscopic spalling events. Piezoelectric accelerometers, offering excellent resolution over very wide bandwidth, are an suitable approach to early detection of high-frequency noise associated with machine wear.
ACCELEROMETER TECHNOLOGY COMPARISION
In a capacitive MEMS accelerometer, the inertial movement of one array of fingers relative to a fixed array is sensed by measuring change in capacitance between the arrays. This is usually done by allowing the change in capacitance to modify a frequency, well above the intended detection bandwidth, which can then be demodulated to obtain a final analog output. Since the device is constantly excited, the power consumption is generally significantly higher than that of a piezoelectric device. Until relatively recently, capacitive MEMS devices have been limited to low-frequency operation, although there is a current trend towards higher-bandwidth devices.
In comparison with MEMS technology, piezoelectric accelerometers can achieve significantly higher bandwidth and superior noise performance (signal resolution). The sensing element is typically piezoelectric ceramic material (or “crystal”) loaded in shear by an inertial mass. Due to the high stiffness and high charge sensitivity of the crystal and the relatively low mass required to achieve typical detection ranges for condition monitoring, the resonance frequency will be minimum >30 kHz, with some designs >50kHz. This allows the passband to extend well beyond 10 kHz. The piezoelectric sensing element itself requires no power, and signal conditioning (charge to voltage conversion) can be provided within a device with very low current requirement.
This device has not been authorized as required by the rules of the Federal Communication, Commission or other regulatory authorities. This device is not and may not be, offered for sale or lease or sold or leased, until authorization is obtained. POC product is available for evaluation purposes only.
AUTHOR
Richard Brown, Field Application Engineer, TE Connectivity